C4DT Running Scenarios: Difference between revisions
| Line 10: | Line 10: | ||
<p>[[File:C4DT_Debug_Button.PNG|right]] To run a scenario in debug mode all you have to do is pressing the Debug button instead of the Run one. The engine will now be halting script execution as soon as it encounters an instruction marked by a breakpoint. Eclipse will highlight the location where script execution halted. Now various views can be utilised to gain information about the current state of variables and objects. More on those views below.</p> | <p>[[File:C4DT_Debug_Button.PNG|right]] To run a scenario in debug mode all you have to do is pressing the Debug button instead of the Run one. The engine will now be halting script execution as soon as it encounters an instruction marked by a breakpoint. Eclipse will highlight the location where script execution halted. Now various views can be utilised to gain information about the current state of variables and objects. More on those views below.</p> | ||
<p>Now that execution is halted you can do three things: | <p>Now that execution is halted you can do three things: | ||
*Step Into: The instruction at the current execution position will be executed. If the instruction contains a function call, the debugger will jump into the function and allow you to continue stepping inside that function. | *Step Into: The instruction at the current execution position will be executed. If the instruction contains a function call, the debugger will jump into the function and allow you to continue stepping inside that function. Default keystroke: F5 | ||
*Step Over: Same as Step Into with the exception that the debugger won't go into subordinate function calls. | *Step Over: Same as Step Into with the exception that the debugger won't go into subordinate function calls. Default keystroke: F6 | ||
*Resume: Resume script execution. The engine will run normally until the next breakpoint is encountered. | *Resume: Resume script execution. The engine will run normally until the next breakpoint is encountered. Default keystroke: F8 | ||
</p> | </p> | ||
Revision as of 12:54, 3 May 2010
Introduction
Before continuing you should make sure that you have completed the steps described in C4DT_Installation_Guide.
Running Scenarios

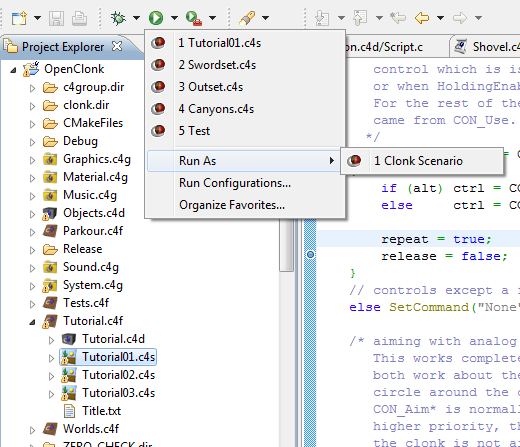
You can run scenarios by selecting it in the Project Explorer and then selecting the option Run Scenario found in the popup menu of the Run button (the green one with the white play symbol).
Debugging

To execute scripts one-instruction-at-a-time and inspect values while the script is halted, you have to switch to the debug perspective first. The layout of the main window changes to acommodate debugging. You can still arrange the views as you want but changes to the layout done while in the debug perspective will stay in the debug perspective, so as soon as you switch back to the Clonk perspective your old layout will be restored.

Apart from window layout there are also some keyboard shortcuts that become available. Among those is the shortcut to create a breakpoint. By default, it's Ctrl+Shift+B. You can open any c4script and place a breakpoint in a line that contains function code by using that shortcut (or alternatively right-clicking the ledge on the left and clicking "Toggle Breakpoint").

To run a scenario in debug mode all you have to do is pressing the Debug button instead of the Run one. The engine will now be halting script execution as soon as it encounters an instruction marked by a breakpoint. Eclipse will highlight the location where script execution halted. Now various views can be utilised to gain information about the current state of variables and objects. More on those views below.
Now that execution is halted you can do three things:
- Step Into: The instruction at the current execution position will be executed. If the instruction contains a function call, the debugger will jump into the function and allow you to continue stepping inside that function. Default keystroke: F5
- Step Over: Same as Step Into with the exception that the debugger won't go into subordinate function calls. Default keystroke: F6
- Resume: Resume script execution. The engine will run normally until the next breakpoint is encountered. Default keystroke: F8
Variables

The Variables view displays local variables and parameters of the function being executed.
Expressions
The expressions view displays a list of user-defined expressions that get evaluated after every execution step. It is evaluated in the context of the calling object so expressions like "GetName()" will work as expected. Local variables and parameters can in principle be used in expressions but evaluation of such expressions might be buggy.

